OUR STORY
The Superfund Group of investment companies launched its first fund in March 1996. Superfund's trend-following trading strategy is based on 20 years of strong research and development of technical trading systems that capture over 120 liquid financial and commodity markets worldwide.
Superfund is a systematic investment manager that uses fully-automated technical trading systems to remove human emotions from trading decisions. Representing the future of investing, these technical trading systems are based on statistical analysis and mathematical modeling of historic data, with the goal to deliver absolute returns in bull and bear markets.
Superfund Group manages funds for retail and institutional investors world wide and is serving clients and partners through its offices in the United States, Europe and Asia.
“Managed futures funds are today’s great undiscovered asset class and from my experience should be part of every private and institutional portfolio.”
Milestones
First retail managed futures fund, Superfund-QAG, was launched.
Superfund launches its first Luxembourg SICAV fund.
Superfund office was opened in Zurich, Switzerland.
Superfund Green, L.P. launched in the United States.
First TV commercials in the U.S. for a managed futures fund.
Superfund opens the first hedge fund walk in center in Europe.
The Superfund Fifth Avenue Investment Center opened in New York.
First Superfund public offering in Japan.
Superfund Gold, L.P., the first retail gold-denominated managed futures fund offered in the U.S..
First retail silver-denominated fund launched in Europe.
Superfund starts to market its first U.S. mutual fund.
See performance table for news on updated Fund expenses effective February 26, 2019 to February 29, 2020
Managed Futures
Managed futures funds are a particularly interesting investment strategy because historically they have offered a significant degree of downside protection, especially in declining equity markets.
With a historically low or even zero-correlation with stocks, one of the most attractive features of managed futures is their ability to add broad diversification to an overall investment portfolio.
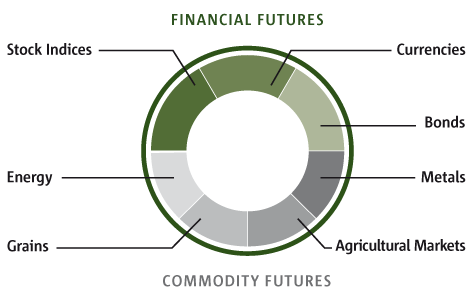
Managed futures funds primarily use standardized futures contracts that trade on highly liquid and strictly regulated futures exchanges worldwide to implement their investment strategies.
Managed futures funds seek absolute returns by taking long and short positions in futures contracts. Unlike some managed futures strategies, which allow for discretion in their trades, the Superfund Managed Futures Strategy Fund uses a highly sophisticated, disciplined, and automated trend following system.
S&P 500, NASDAQ, Nikkei 225 …
US T-Bonds, EURO-Bund, Japanese Government Bonds …
Managed futures funds have the potential to profit from rising (long) and from falling (short) markets.
USD/JPY, USD/EUR, EUR/GPB …
Metals, Energies, Grains, Meats …
Reasons to Invest
1. High Performance Potential
The graph below shows that managed futures, represented by the CISDM CTA Equal Weighted Index, have historically produced high returns with relatively low volatility. From 01/1980-09/2015 managed futures have also produced absolute positive returns in rising and falling markets versus stock and bond indices.*
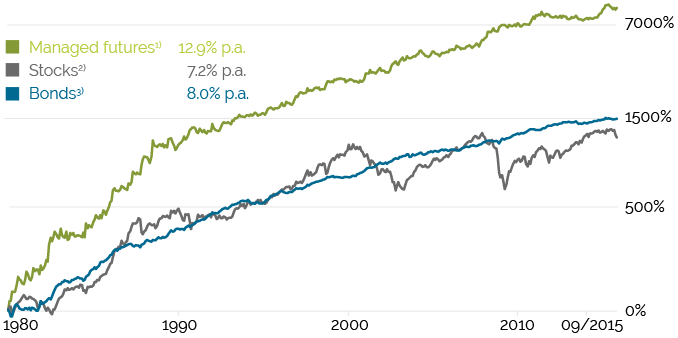
Timeframe: 01/1980 09/2015; Source: TeleTrader; 1) CISDM CTA Equal Weighted Index: An index of approximately 300 commodity trading advisers that voluntarily report their performance to the CISDM; 2) MSCI World Index: A market-capitalization-weighted equity index composed of approximately 1,000 companies in 20 developed countries 3) Barclays US Aggregate Bond Index: The index measures the performance of the U.S. investment grade bond market securities, all with maturities of more than 1 year.
This chart represents the longest common period for the three indices represented. Results over different time periods may vary. Investments cannot be made in an index.
The indices used do not reflect any fees, expenses or sales charges. In addition past performance is no guarantee of future results. Index performance is not indicative of the performance of the Superfund Managed Futures Strategy Fund.
2. Low Correlation
Investors are drawn to managed futures because historically they’ve shown a low correlation to other major asset classes. As an example, the chart below compares performance of the S&P 500 and CISDM CTA Equal Weighted Index from 01/01/1980 through 09/30/2015.
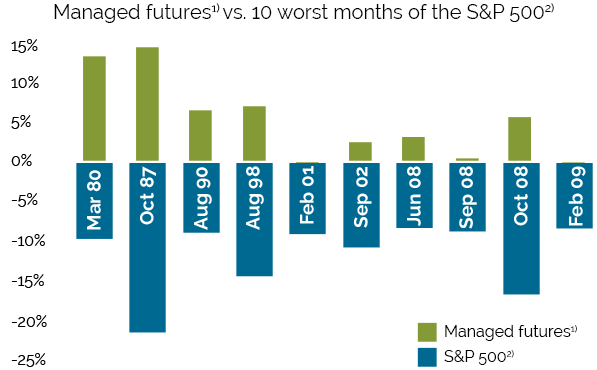
Timeframe: 01/1980 09/2015; Source: TeleTrader; 1) CISDM CTA Equal Weighted Index: An index of approximately 300 commodity trading advisers that voluntarily report their performance to the CISDM; 2) S&P 500: A benchmark of U.S. common stock performance. It includes 500 of the largest stocks (by market value) listed in the U.S. This time frame was chosen to show the long term performance of managed futures as represented by the CISDM CTA Equal Weighted Index.
3. Potential to Limit Drawdowns
Managed futures also have the potential to limit drawdowns the reduction an investment may periodically experience. Historically, the severity and duration of the draw downs for managed futures has been less than other major indices.
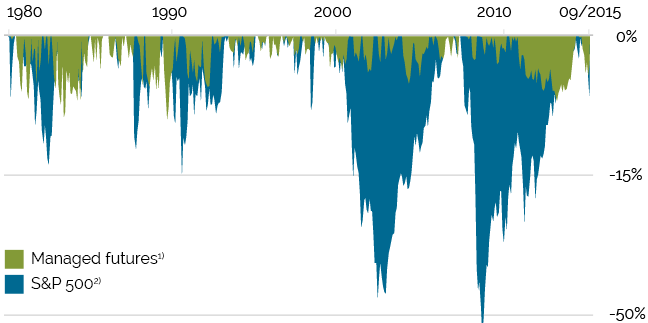
Timeframe: 01/1980 09/2015; Source: TeleTrader; 1) CISDM CTA Equal Weighted Index: An index of approximately 300 commodity trading advisers that voluntarily report their performance to the CISDM; 2) S&P 500: A benchmark of U.S. common stock performance. It includes 500 of the largest stocks (by market value) listed in the U.S. It is considered to be the most important benchmark for market developments in the U.S.
This chart represents the longest common period for the two indices represented. Results over different time periods may vary. Investments cannot be made in an index.
4. Enhanced Portfolio Efficiency
Managed futures have been used to enhance investment portfolios by reducing volatility and improving the risk-adjusted returns over time. As a simple example, this graph illustrates what different combinations of the S&P 500 and CISDM CTA Equal Weighted Index have done from 1/1980-9/2015.
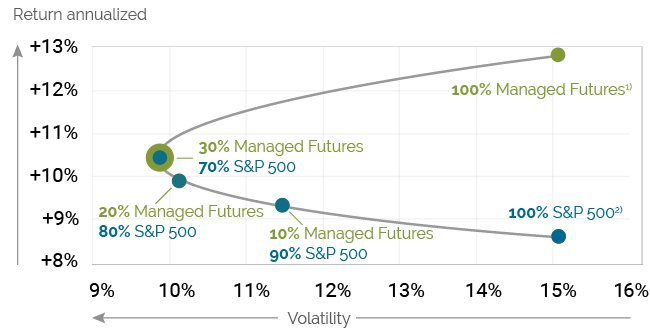
Timeframe: 01/1980 09/2015; Source: TeleTrader; 1) CISDM CTA Equal Weighted Index: An index of approximately 300 commodity trading advisers that voluntarily report their performance to the CISDM; 2) S&P 500: A benchmark of U.S. common stock performance. It includes 500 of the largest stocks (by market value) listed in the U.S. It is considered to be the most important benchmark for market developments in the U.S.
This chart represents the longest common period for the indices represented. Results for different timeframes may vary. Investments cannot be made in an index.
The 4 pillars of our investment process are:
Technical Trading Systems
Superfund use a proprietary algorithm that has been refined over the last 20 years to initiate positions. This disciplined and technical approach to investing effectively eliminates emotional miscalculations periodically seen with other investment strategies.
Trend Following
We don't project the future outcome of an investment. Instead, we focus on detecting clearly defined investment trends over the short, medium and long term horizons and take advantage of them. Once defined, the funds follow a trend until the risk management system tells otherwise. In this way, the Superfund trading strategy seeks to optimize winning trades.
Market Diversification
At a glance 120 markets seem diversified, yet different investments often act the same. Fundamental to our strategy is ensuring that there is a low correlation amongst portfolio holdings. This ensures the portfolio is properly diversified, enabling us to weather different market conditions.
Diversification does not ensure a profit, or protect against loss.
Risk Management
Consistent risk management represents the most important element of the trading strategy. The proprietary Superfund trading systems constantly monitor all risk factors and electronically initiate buy and sell orders based on technical analysis. In the event of a major trend reversal due to new factors in the market, the program adjusts to the new environment. In this manner, the systems aim to minimize losses and increase profit potential.